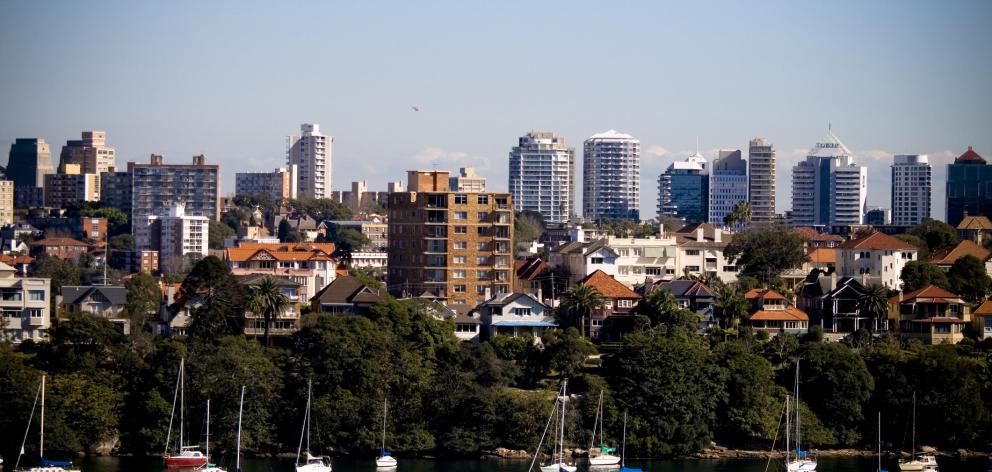
Home prices across Australia's capital cities have risen an average of 10.2% in the year to March 2017, driven by Sydney's strong property market.
The Harbour city led the pack with an average annual home price lift of 14.4%, according to figures released by the Australian Bureau of Statistics on Tuesday.
Melbourne was only just behind recording an annual increase of 13.4%.
Hobart was also a strong performer, with an increase of 11.3% for the year, and lifting 3.4% in the March quarter, the highest quarterly rise of all the capitals.
Meanwhile, Darwin and Perth had the weakest outcomes, being the only two cities to post a fall in prices in both the March quarter and the year to March.
Darwin slipped 5.9% for the year while Perth dropped 3.5%.
The were both also lower for the quarter, down 0.9% and 1.0%, respectively.
Overall, residential property prices rose 2.2% in the March quarter, marking the fourth consecutive quarter of growth.
The ABS figures found the total value of Australia's roughly 9.9 million residential dwellings rose $163.1 billion in the quarter to $6.6 trillion, only six months after reaching the $6 trillion mark in September last year.
The mean house price in Australia stands at around $670,000.
NSW ($886,800) remains at the top of the country for the mean house price, followed by Victoria ($708,300), with Tasmania ($357,000) recording the lowest mean price for the March quarter.
CAPITAL CITY HOME PRICES:
- Sydney - up 3.0 pct in March quarter, up 14.4pct in the year
- Melbourne - up 3.1pct and 13.4pct
- Hobart - up 3.4pct and 11.3pct
- Canberra - up 2.8pct and 8.9pct
- Adelaide up 1.5pct and 5pct
- Brisbane - flat and up 3.5pct
- Perth - down 1pct and down 3.5pct
- Darwin - down 0.9pct and down 5.9pct