

SUBSCRIBER
Vulnerable group poorly served
The way Health New Zealand Te Whatu Ora (HNZ) has changed services for intravenous drug users in the South has been a master class in how not to treat a vulnerable group.
SUBSCRIBER
SUBSCRIBER

SUBSCRIBER
SUBSCRIBER

SUBSCRIBER
SUBSCRIBER
SUBSCRIBER
SUBSCRIBER

SUBSCRIBER
SUBSCRIBER

SUBSCRIBER
SUBSCRIBER

SUBSCRIBER
SUBSCRIBER
SUBSCRIBER
SUBSCRIBER

SUBSCRIBER
SUBSCRIBER

SUBSCRIBER
SUBSCRIBER

SUBSCRIBER
SUBSCRIBER

SUBSCRIBER
SUBSCRIBER

SUBSCRIBER
SUBSCRIBER

SUBSCRIBER
SUBSCRIBER
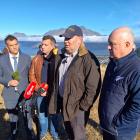
![NZ First leader Winston Peters speaks earlier this year. PHOTO: Peter Righteous [via ges]](https://www.odt.co.nz/sites/default/files/styles/odt_square_2col/public/story/2026/05/petersblackball.jpg?itok=A7RBPuDF)
SUBSCRIBER
SUBSCRIBER

SUBSCRIBER
SUBSCRIBER

SUBSCRIBER
SUBSCRIBER

SUBSCRIBER
SUBSCRIBER

SUBSCRIBER
SUBSCRIBER

SUBSCRIBER