The first food pyramid was created back in the 1970s in Sweden. Before that, everyone just ate meatballs*.
*OK, so not just meatballs.
But the pyramid — with its fresh veg at the bottom — helped people identify what was better for them to eat, in order that they should eat more of it. And less of some other things.
It’s an example Adrian Feasey, the low carbon living team manager at Auckland Council, uses to explain why a project he’s been involved in might play a similarly useful role when it comes to our carbon footprints.
There’s quite a lot of overlap with diet, as it turns out.
The project is called Future Fit, and it’s an app. Auckland Council put it together after doing some research on climate change action and public perceptions.
What they found was that 86% of Aucklanders were willing to change their lifestyles to meet climate commitments. Two in five were willing to make radical change.
However, many didn’t know where to start to have the greatest impact.
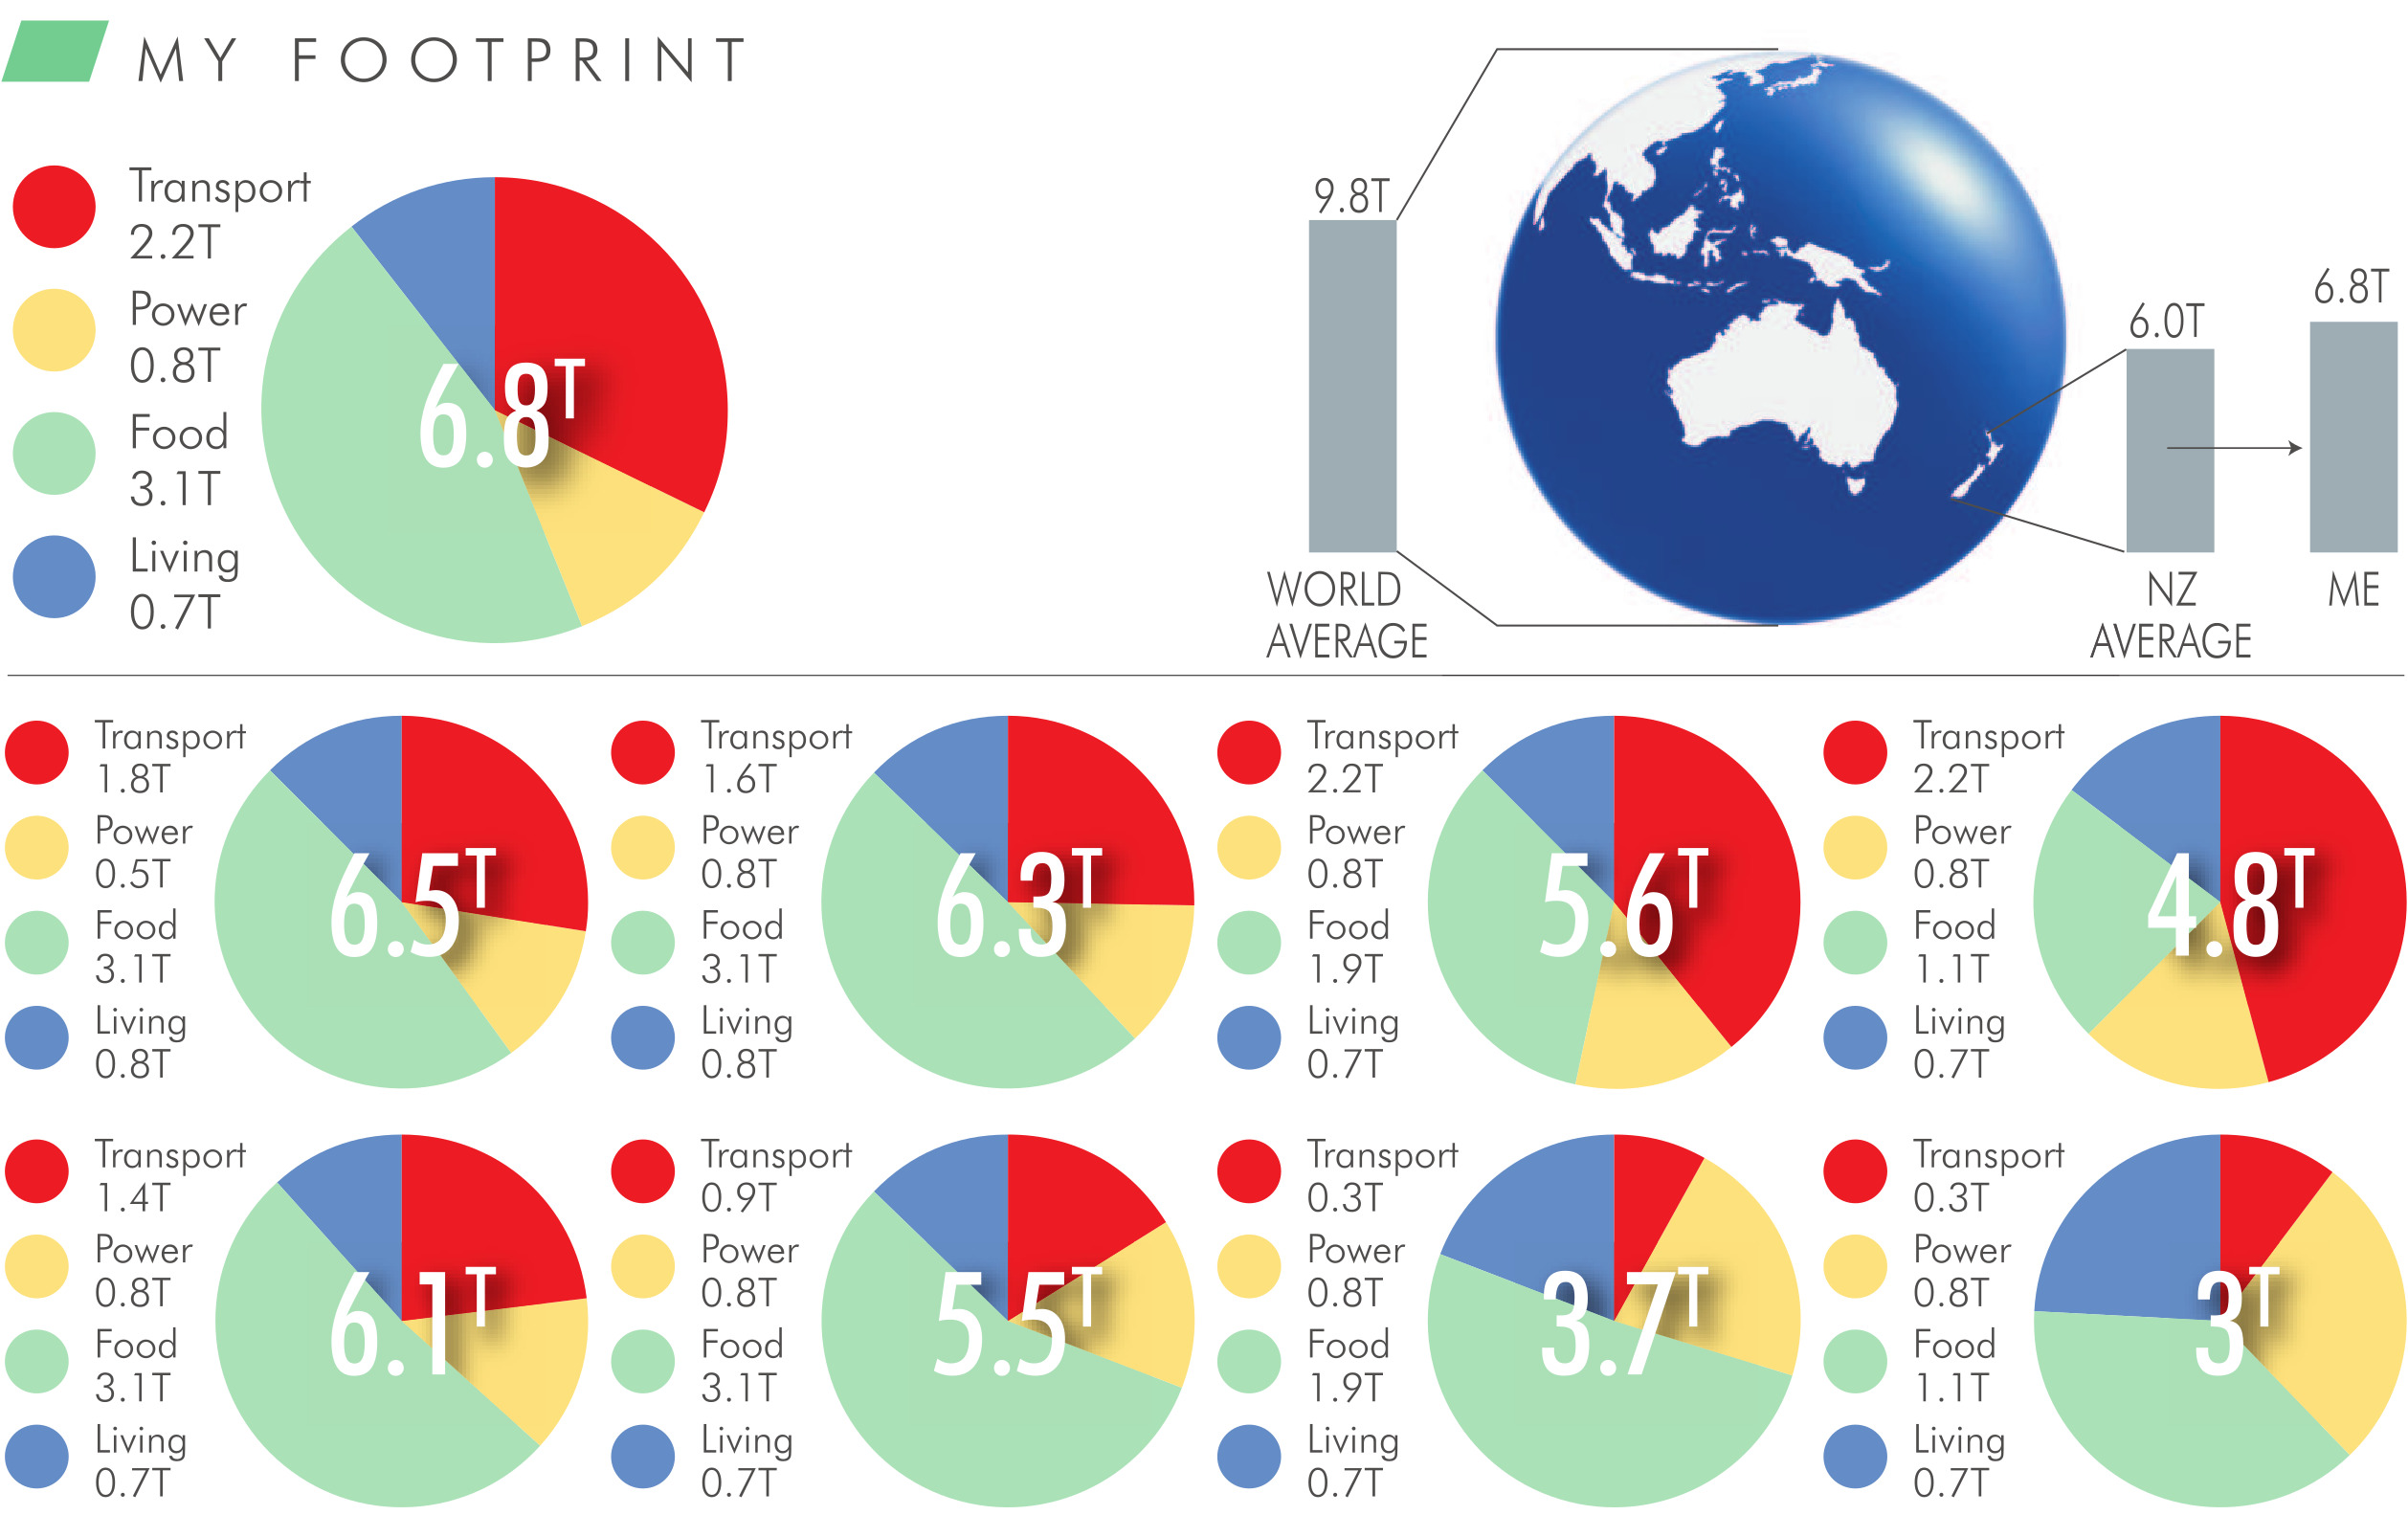
So, the council built Future Fit, which is designed to give people a quick snapshot of their carbon footprint, let them know where the biggest chunks are coming from and what personalised actions they can take.
"It is certainly our intention, and our hope, that more New Zealanders will become familiar with their carbon footprint, I guess, in a similar way that we have seen with other public health or public education campaigns," Feasey says.

"Well, we know, based on the experience to date, we have had over 16,000 New Zealanders who have calculated their carbon footprint so far and that the average active user, so somebody who creates an account and then selects an action, they save approximately 730kg of carbon per year.
"If we get 10% of New Zealanders to become active users, we could save over 300,000 tonnes of CO2."
Some of those using the app are already from the South. Anyone can jump on the website and sign up. And Dunedin City Council’s Te Ao Turoa Partnership has endorsed it.
There are other territorial authorities looking at it, as well as some big corporates, Feasey says.
The app’s based on work by Motu Economic and Public Policy Research. Carl Romanos, Suzi Kerr and Campbell Will looked at the carbon emissions generated by household consumption in New Zealand — so the country’s large methane footprint from pastoral farming is not a big part of this picture — and the opportunities for mitigating them, both through individual actions and public policy.
So, for example, that might be an individual choosing to use more public transport or changing their "food bundle". In terms of policy, it might be improving public transport and helping households improve energy efficiency.
"We believe quite strongly that both are required," Feasey says — public and private action, top-down and bottom-up.
"We do need a top-down [approach] and some of the policy and leadership and investment decisions being made, but at the same time we have a lot of agency as individuals and households and every day we make decisions that impact on the environment or impact on the way we get to work, the way we consume."
Big emitters
The top seven contributors to New Zealand’s industry and household emissions in 2018 were:
• agriculture, forestry, and fishing, 41,300 kilotonnes
• manufacturing, 10,728 kilotonnes
• household, 9765 kilotonnes
• electricity, gas, water, and waste services, 7655 kilotonnes
• transport, postal and warehousing, 5946 kilotonnes
• mining, 1541 kilotonnes
• construction, 1232 kilotonnes.
Source: Stats NZ
City footprint
Dunedin’s key energy trends over 2016-2019 headed in the opposite direction from the city’s goals:
• Dunedin’s annual energy consumption has increased from 11.61PJ to 13.65PJ, a 17.6% increase, or an average of nearly 4.5% per year.
• Energy consumption per capita has increased from 25.39MWh to 28.79MWh per capita, a 13% increase, or an average of 3.25% per year.
• Energy consumption per unit of GDP has increased from 570MWh to 615MWh per $million GDP, a 7.9% increase (i.e. energy use has become less efficient), or an average of nearly 2% per year.
• There has been an increase in the proportion of non-renewable fuels in the energy supply from 63% to 67%.
• Energy-related greenhouse gas emissions have increased 15.7%, an average increase of nearly 4% per year.
Source: Dunedin Energy Study 2018/2019


