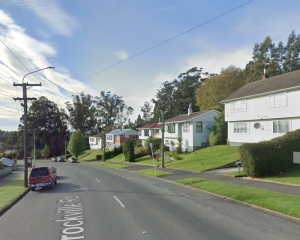
A recently developed deprivation index is shining the spotlight on Otago's problems - and revealing Dunedin city is lagging behind other parts of the region when it comes to health, employment and income.
The Child Poverty Action Group charity has launched a series of discussion documents looking at the concentration and drivers of deprivation in Nelson-Marlborough, Canterbury and Otago.
The discussion documents use an index produced by a team at the University of Auckland School of Population Health, which identifies and measures concentrations of deprivation in New Zealand - collecting data from individual neighbourhoods or data zones.
The index focuses on seven main areas of deprivation: employment, income, crime, housing, health, education and access to services.
Compared to other parts of Otago, Dunedin neighbourhoods were ranked most often in the bottom 20% for health, employment and income, but most often in the top 20% for access to services.
Queenstown-Lakes performed the best across Otago on measures such as education, employment and income.
Clutha led the way in affordable and available housing - more than 80% of its zones were in the top 40% - and Central Otago rated best when it came to health.
Dunedin city was the only district in the Otago region with data zones among the 20% most deprived for health.
University of Auckland Associate Prof Dr Dan Exeter travelled to Dunedin and Christchurch to publicly discuss the development of the IMD and how it could be used.
He spoke at Dunedin Community House last night.
''The situation for people suffering the ill-effects of disadvantage isn't going to get better any time soon, unless we get real about the causes of deprivation,'' Prof Exeter said.
''The IMD's strength is its ability to drill down to see which of the seven domains are driving deprivation in each region, because it varies from region to region.
''High rates of crime in one area may be significant while it may be poor health outcomes in another.''
While there was ''no denying that there are levels of hardship in Otago'', what surprised him was the comparatively low levels of deprivation across the region, he said.
Nationwide, Otago had the second lowest number of zones in the lowest 20% when it came to all types of deprivation and the second-highest number in the top 20%.
Across the country, the region that performed best on the index was Southland.
The Otago-specific report showed the most significant contributor to deprivation in the region was access to services - measured by proximity to three GPs, supermarkets, service stations, schools and early childhood education centres.
The lack of access was ''not surprising given the geography of the province'', the report said.
74.4% of data zones in Queenstown and 62.5% of data zones in Clutha were considered in the bottom 20%.
The best area for employment in Otago was Queenstown-Lakes, with 94.9% of all zones falling in the top 20%.


