PHOTO
The number of Otago secondary schools that fail to meet the national average pass rate in all levels of the national certificate of educational achievement (NCEA) is continuing to rise, recently released statistics from the New Zealand Qualifications Authority show.
This contrasts with the number of secondary school pupils gaining NCEA qualifications nationwide increasing at all three levels for the fifth consecutive year.
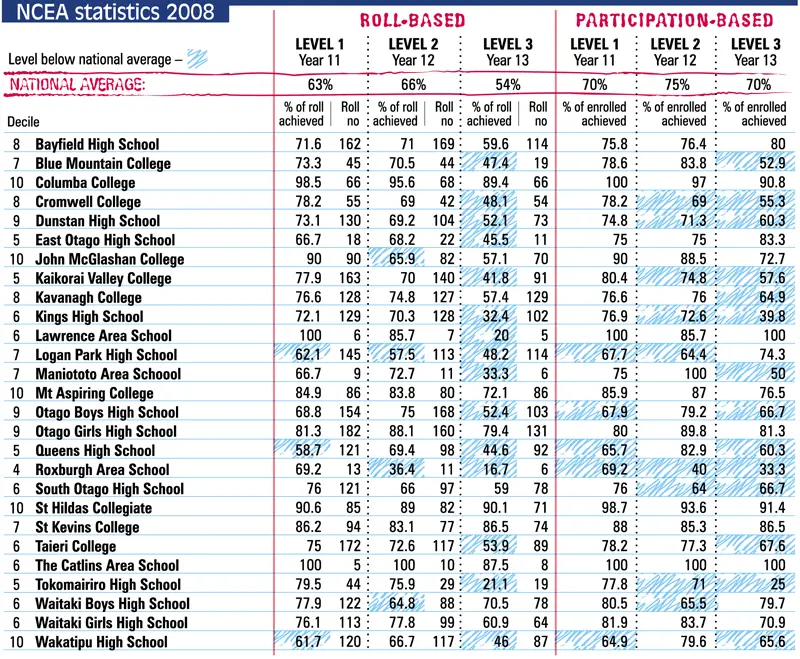
NZQA's roll-based statistics showed more than half of Otago's secondary schools have fallen below the 2008 national average of pass rates in NCEA level 3.
Of the 27 secondary schools in the region, only 12 exceeded the NCEA level 3 national average of 54%.
In 2007, 13 secondary schools exceeded the level 3 national average of 53.5%, and 16 exceeded the average of 51.6% in 2006.
At level 1, three Otago schools failed to meet the national average of 63% in 2008, compared with one in 2007.
And at level 2, four schools did not meet the 2008 average of 66%, compared with three in 2007.
On the positive side, several schools recorded excellent pass rates.
Columba College topped level 1 in Otago, with 98.5% of the school's roll achieving NCEA qualifications.
Lawrence Area and The Catlins Area Schools scored a perfect 100%, but there were fewer than six pupils on their year 11 roll.
Additionally, Columba College topped level 2, with 95.6% of the school's roll achieving NCEA qualifications.
St Hildas Collegiate School topped level 3 with 90.1%.
This year, the NZQA introduced a new method of displaying NCEA results - participation-based statistics - which are more accurate.
Deputy chief executive qualifications Bali Haque said the new statistics were presented as a response to consultation with schools and provided more accessible and comprehensive information than in the past.
Participation-based statistics show only the pass rates of pupils enrolled in NCEA levels at each school.
The roll-based statistics show the total number of pupils at year 11, 12, or 13, and percentages are calculated on those figures.
They are considered less accurate because not all of those pupils are enrolled in NCEA levels 1, 2 or 3.
While the participation-based statistics are more robust, they do not make the picture of achievement in Otago secondary schools more attractive.
Using this information, five Otago schools failed to reach the 70% national average of participating year 11 candidates who achieved NCEA level 1.
Nine schools did not reach the 75% national average in level 2 and 14 schools did not reach the 70% national average in level 3.
Otago Secondary Principals Association chairman and Kaikorai Valley College principal Philip Craigie said making comparisons between schools was very complex, and he warned against it.
Many pupils who stayed on to study NCEA level 3 at his school found employment halfway through the year, he said.
Yet they were still counted on the NCEA statistics, even though they did not sit any exams.
The situation corrupted the data, he said.
"People are in year 13 for a variety of reasons - not just to get a level 3 qualification or entrance to university. They may be still at school following a career path and getting qualifications that can lead to further training for employment.
"We have a high number of pupils who go on to apprenticeships, trades training and other work opportunities."
There was also variety in the quality of cohorts which go through schools, he said.
Academia from year to year could vary dramatically.
Mr Haque said the statistics provided useful information for schools and teachers in planning their years.
However, he, too, cautioned against using the data to compare schools.
Factors such as decile, roll numbers and make-up of courses offered, and course design, were specific to each school; and these influenced a school's statistics, he said.
Notes
Schools have distanced themselves from media publication NZQA figures, saying they offer no valid comparison because different schools offer different acheivement and unit standards.
National Certificate of Educational Acheivement is part of the National Qualifications Framework, and it is made up of unit standards and acheivement standards.
Every standard is worth a set number. Credits are like points towards a qualification. When pupils have 80 or more credits at a level they are awarded the NCEA.
Level 1 of NCEA was introduced in place of School Certificate in year 11 in 2002. Level 2 replaced Sixth Form Certificate in 2003 and level 3 and scholarship replaced university bursary in 2004.
A school's decile rating takes into account the characteristics of its catchment. The ratings range from 1-10 with pupils in high decile school generally coming from backgrounds making them more likely to succeed academically.
The roll is based on the number of pupils recorded of the senior roll at July 1 and can include pupils not entering NCEA standards or pupils doing other levels of NCEA.